Warning: geek alert!
Last week, I raved about how easy Ozzie Gooen’s Guesstimate made Monte Carlo simulations. But, I wanted more: “… imagine if you could draw your own curve for the distribution: a kind of click-and-drag option”, I mused. Straight away, Ozzie highlighted that he’d enable this in tandem with Distshaper. So, this week, I thought I’d follow up with a look at that.
What is a distribution curve?
I’m going to let mathsisfun.com explain this:
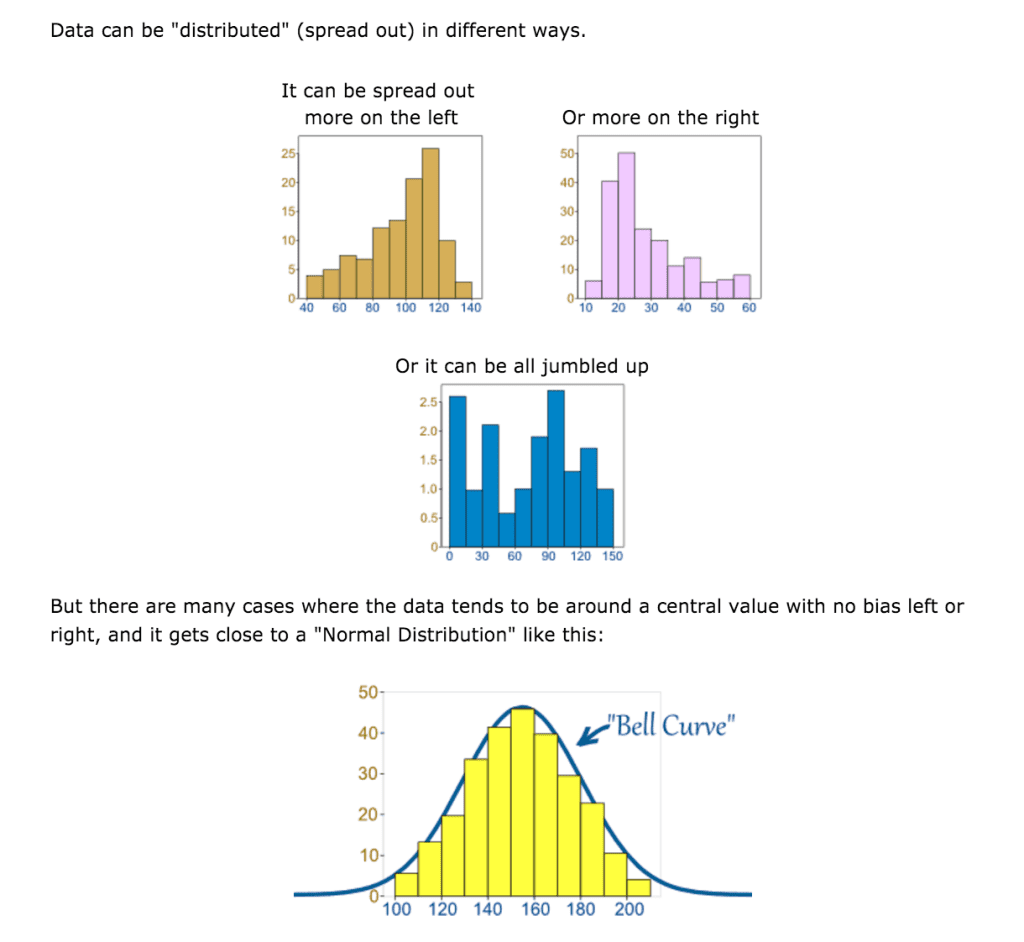
When I took a look at guesstimate.com last week, my min/max range was automatically made a normal distribution.
What’s wrong with a normal distribution?
Although many things in life have a normal distribution (such as shoe sizes, height, test results, weight), many things do not (such as how long work items take teams performing knowledge work). In my Monte Carlo simulation, the cost that I sell each unit might be much more skewed to sell nearer to £5 than £10.
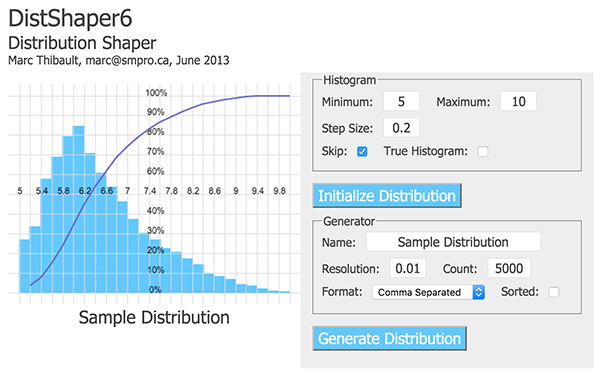
So why does Distshaper6 help me?
Distshaper6 allows you to bend your curve to reflect your reality. Like Guesstimate, you don’t need to type in complicated formula, you simply enter your min/max bounds and sample size, draw your curve over the histogram using your mouse, then copy the output and paste it into Guesstimate.
Let me show you:
You can see that the mean return changes from 210k (+/- 390k) at the start of the video to 160k (+/- 330k) after I’ve changed the distribution curve of the unit price.
Hopefully that makes sense, but a couple of minutes on the Distshaper site will clarify it for you. It really is that simple.
Beautiful tool and post!
Question:
If you UNCHECK
the True Histogram [ ] checkbox (ie: if you leave it blank),
what do the percentages (0 to 100%) on the Y-axis
actually represent?
For example,
for this simple (ordered) series of 10 values
pasted at the bottom:
−0.2, 0, 0.1, 0.1, 0.3, 0.4, 0.5, 0.5, 0.6, 1.6
with:
min = -0.2, max= 1.6 and Step Size= 0.5
I pressed [Initialize Distribution].
a) If True Histogram [ X ] IS checked,
DistShaper6 will show the expected % values:
10%, 70%, 10% and 10% (for a total of 100%.)
Fine!
b) If True Histogram [ ] IS NOT checked,
DistShaper6 will show slightly different bar heights,
with different % values…
In this case,
what do these % values mean (in plain English)?.
Thanks!!!
SFer
Thanks for the comment SFer. I have to admit that, as I wasn’t using it that way round (I was dragging the curve to represent distribution), I didn’t see that. I have asked Distshaper’s creator, Marc Thibault, for a response to your comment.
Thanks, David!
Looking forward to Marc’s answer
in this excellent blog post.
I must be missing something basic… 🙂
What I like the most in your blog (and Marc’s),
are the really clear explanations.
SFer
Sorry guys. I thought I’d responded to this. I was wrong.
In any case, if you select the ‘True Histogram’ The bar heights are correctly scaled for the corresponding probabilities. If you uncheck it, the resulting histogram preserves the shape, but not the scale. I don’t remember the algorithm I used to do that. Because histograms are mainly useful for showing relative probabilities, I didn’t worry much about it.
Cheers