Probabilistic forecasting is an alternative to an estimates based approach. Rather than asking your teams to break down a lot of work up front, and then estimate it, we can use past data generated by the team from the work they’ve already done to extrapolate a forecast of what may happen in the future.
In his post last year: Little’s Law, David Lowe describes the relationship between lead time (LT), delivery rate (DR) and work in progress (WIP). If you were inspired by David’s post, and are already focussed on limiting WIP in order to reduce lead time and increase delivery rate, you will probably be collecting data. We can take an average of this data over time to create a forecast.
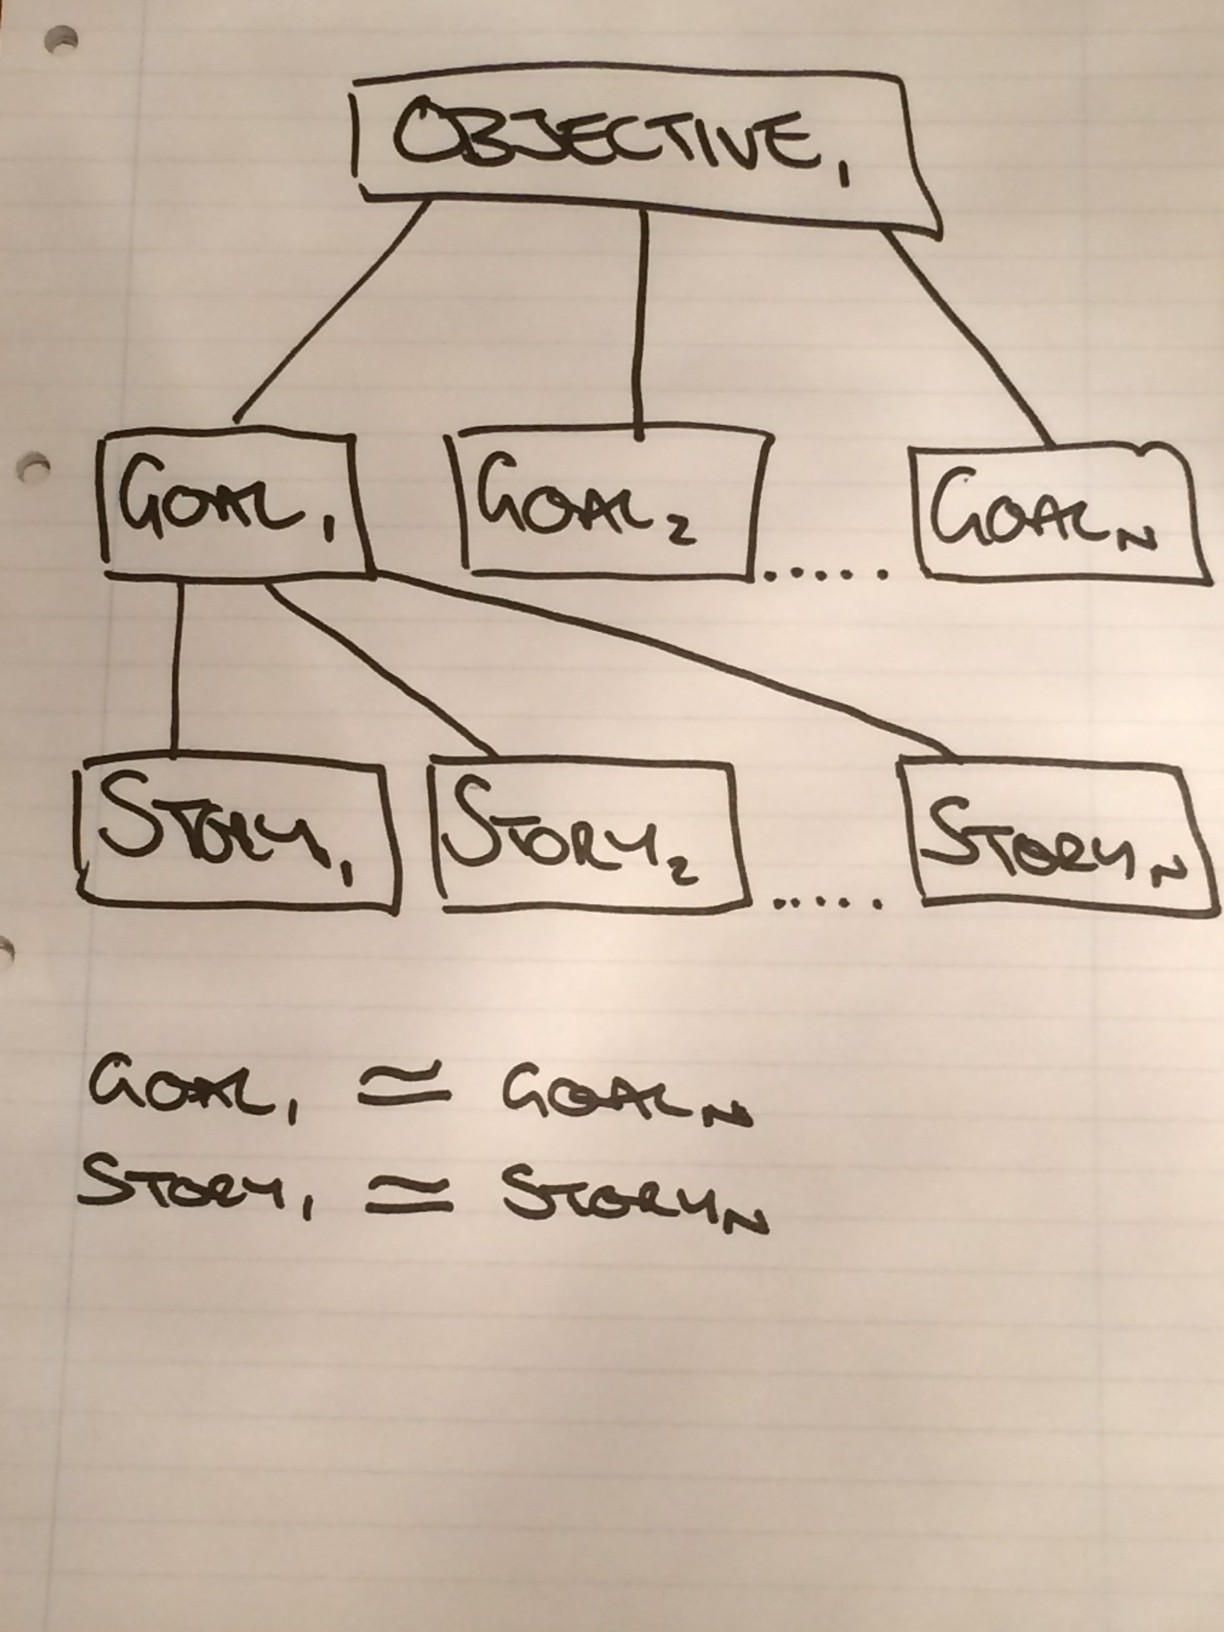
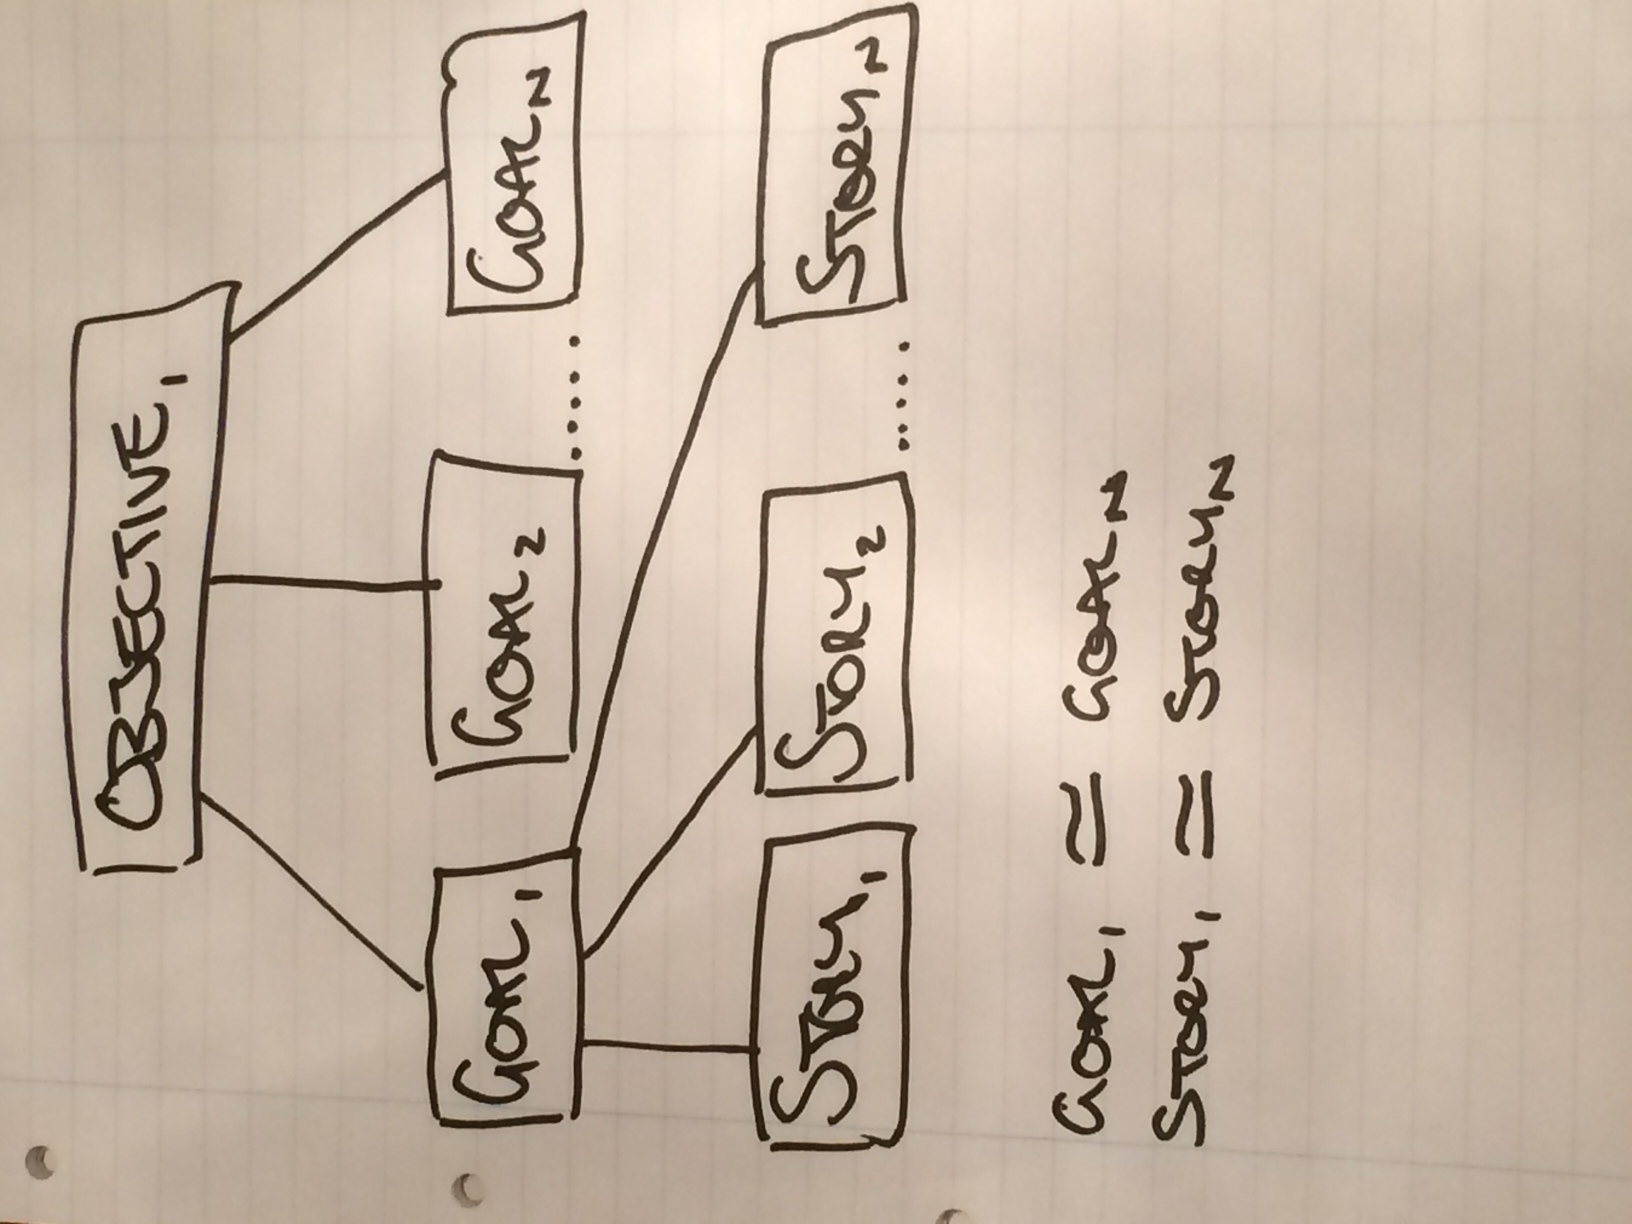
Before we look at the maths, I want to touch on process. We know that if we want to be successful, we need to be pulling in the same direction. A good way to achieve that is to make our objectives and goals clear. In order to create our forecast, it helps to visualise those objectives and goals, and eventually the work we are going to undertake to achieve those. With reference to the diagram below, we can see one to many relationships between our objectives, goals and stories.
If we try to remove as much variance from the sizes of our stories as possible, and break each goal down into a set of stories that are all roughly the same size and all relatively small, we can use them, with our average lead time (ALT) and our average delivery rate (ADR), to create our forecast.
If; G1 = Goal1
and; Sn = number of stories in Goal1
then our forecast for Goal1 is; G1 = (Sn / ADR) + ALT
Where ALT is the time it will take the first story to flow through our system.
If we’ve done a similar job with our goals as we did with our stories, and they are roughly the same size as each other, or we’ve sized them relatively (e.g. we know that Gn is twice as big as G1), then we can extrapolate a forecast for the entire objective, by simply breaking down the first goal, just in time to work on it.
If; O1 = Objective1
and; Gn = number of goals in Objective1
then our forecast for Objective1 is; O1 = Gn x G1
As we undertake the work for Goal1 our ALT and ADR will fluctuate slightly. Very quickly we can adjust our forecast accordingly and communicate that to our stakeholders. Having delivered the value of each story in Goal1, and the goal itself, we can then repeat the process for Goal2 just in time to work on it, and so on until we’ve either completed all of the work for the objective, or we’ve decided to stop working on it.
Warning!
This method will only provide you with a very basic forecast. It can be used as a finger in the air, or a guide for smaller chunks of work. To increase your confidence levels for larger projects, further work will need to be undertaken. Monte Carlo Simulators are one possible option.