As Jeff Sutherland finished describing how important the burndown chart had been in the creation of Scrum, I started feeling guilty for my previous attacks [on burndowns, not on Jeff].
But then I started thinking of examples of how burndowns can easily fail to reflect reality. Even if we ignore the risk of them convincing us that everything is going well when it isn’t (see previous blog post), the burndown can easily fail to show us the full story.
Let me explain using two scenarios.
Scenario 1
Work starts off well and we deliver consistently for the first week. Then we hit a snag. We deliver nothing for a day. We then get back on track and continue to deliver.
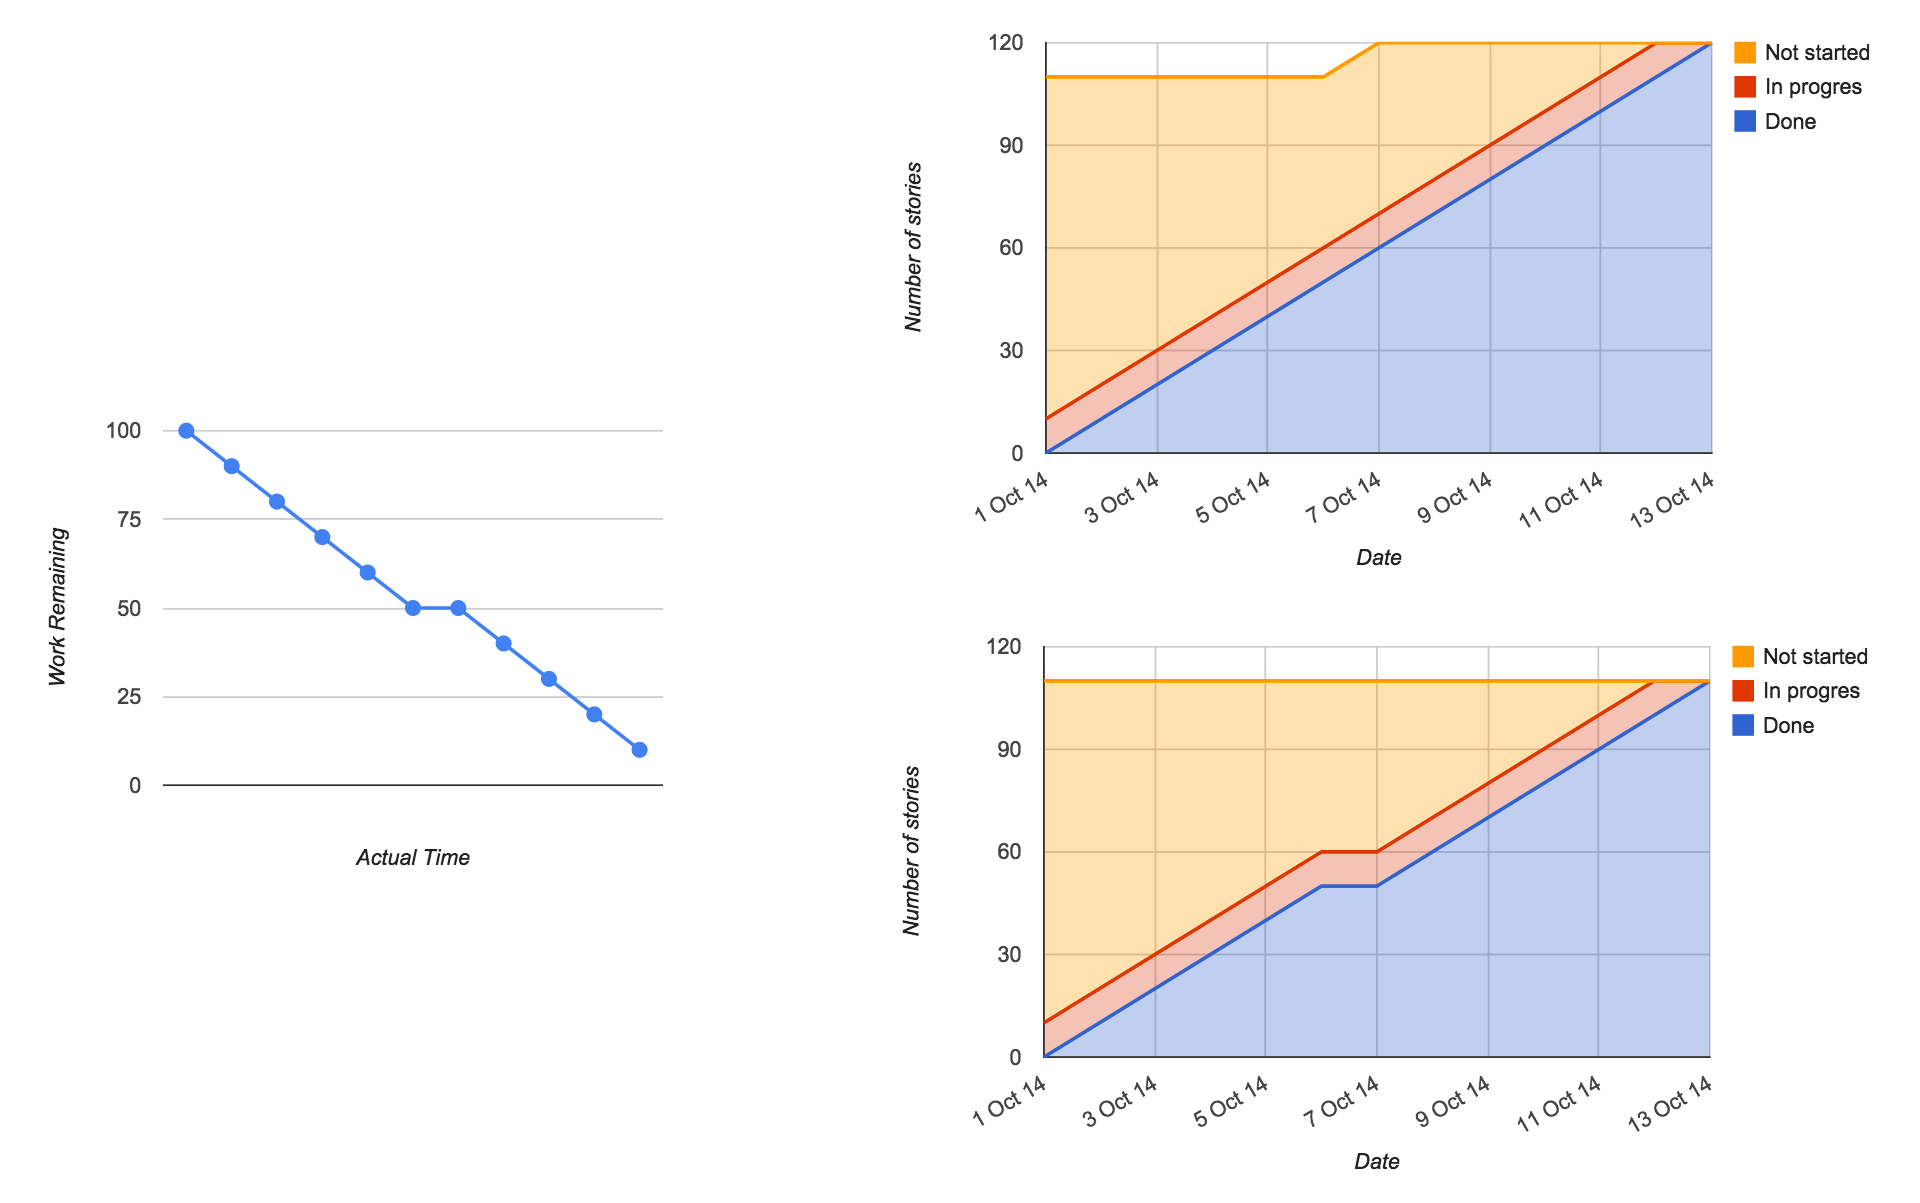
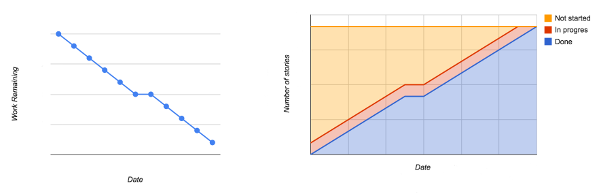
This is how scenario 1 would look on a burndown and a CFD:
Scenario 2
The team consistently delivers throughout the whole period. However, half way through, the scope is increased.
This is how scenario 2 would look on a burndown and a CFD:
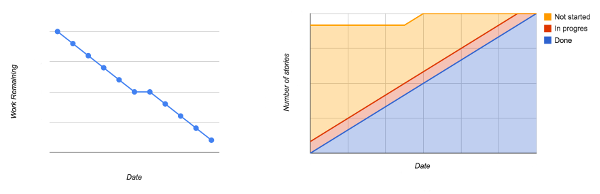
Do you notice the difference in the graphs? That’s right: although the CFD differs to show a lack of delivery or increased scope, the burndown stays the same.
Maybe I’ve been a bit hard on the burndown chart; I appreciate that they can have a significant motivational impact. However, I just cannot ignore how easily they can hide the truth.
Did you know that Jeff Sutherland used to be a ‘Top Gun’ fighter pilot and achieved his doctorate for research into cancer? Check out Scrum: The Art of Doing Twice the Work in Half the Time![]() .
.
Hello
That’s why I created an improved version of the traditional burn down chart. You can read all about it here: https://www.linkedin.com/pulse/improved-burndown-chart-scope-guy-larochelle?_mSplash=1&trk=prof-post
Basically, I added a scope line on the chart.
I hope this can help!
Thanks
Guy